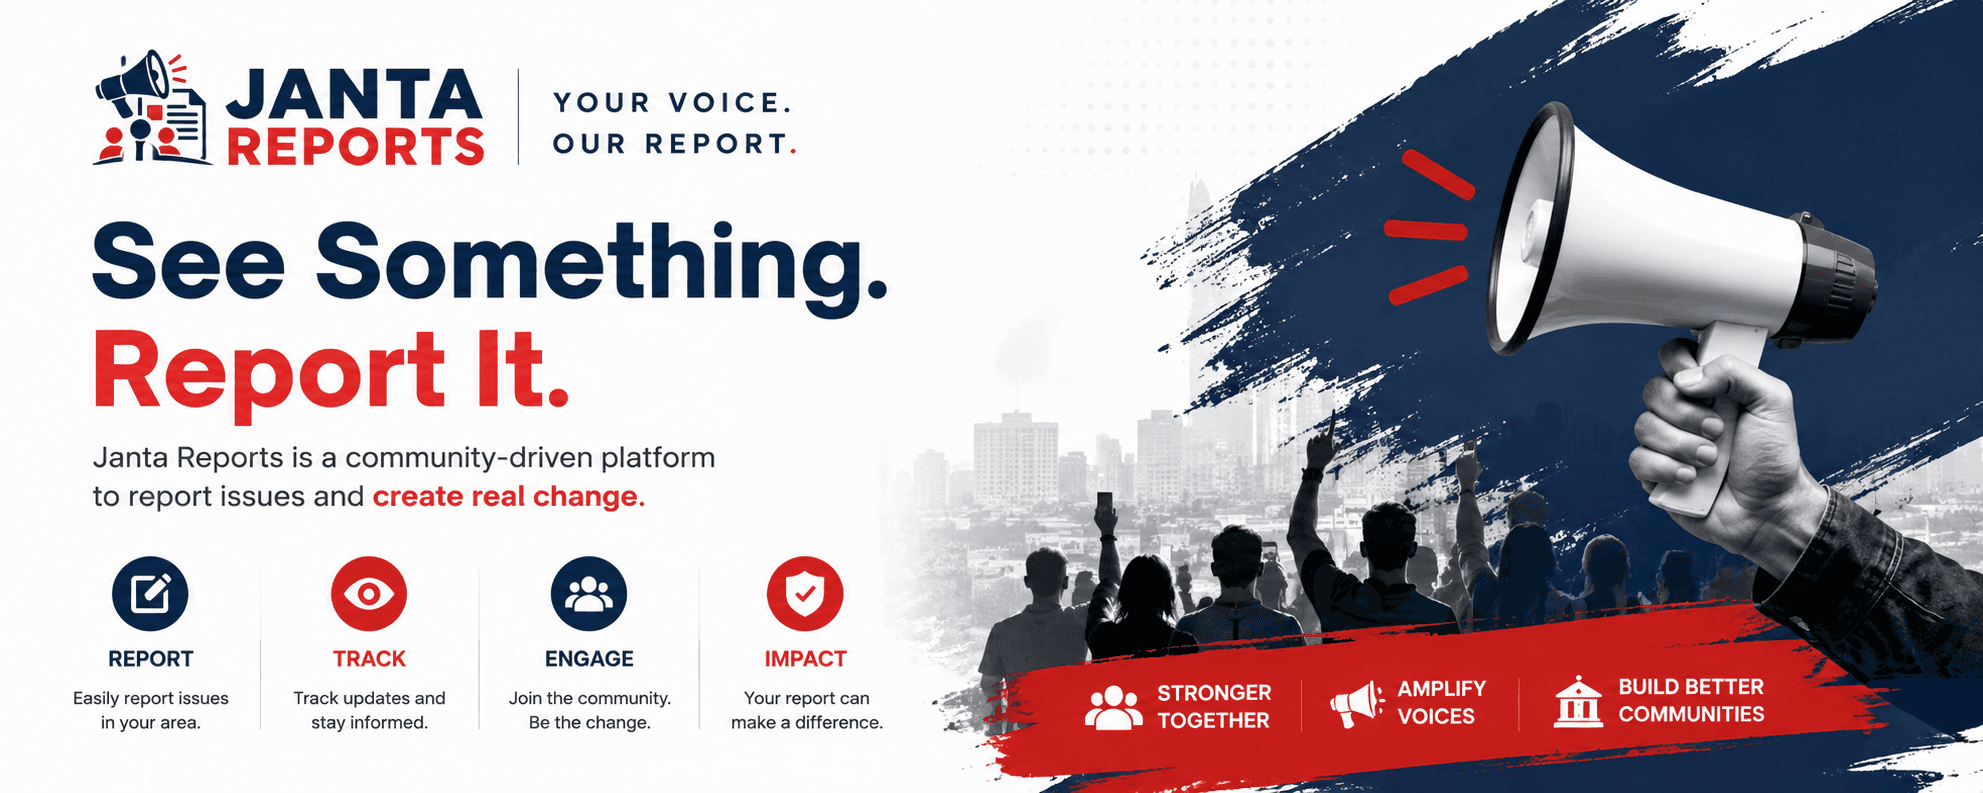
Janta Reports
Real stories. Real impact. From every place, for every voice.
Janta Reports is a civic reporting platform that gives citizens a direct, trackable way to report infrastructure problems — damaged roads, blocked drains, unsafe intersections, environmental hazards — straight to the municipality responsible for fixing them.
Technology
What wasn't working.
- 01Municipal complaints are difficult to file and even harder to follow up on.
- 02Citizens rarely know which office or department is actually responsible for a given issue.
- 03There's no shared, transparent record of what's been reported or what's been done about it.
What it does instead.
A modern reporting platform that connects citizens directly with their municipality: pick a ward, pin the exact location, attach a photo, and submit — the report enters a structured queue instead of disappearing into a phone call or a social media post.
Research
Before writing any code, the starting point was ordinary complaint patterns — how people already report problems informally (phone calls, Facebook posts, word of mouth) and where that informal process breaks down: no record, no accountability, no way to check status later. The product exists to formalize that flow without making it slower.
What it actually does.
Ward Selection
Reports are tied to a specific municipal ward from the first step, so they route to the right office instead of a generic inbox.
GPS Location Pinning
Every report carries an exact coordinate, not just a written address — removing ambiguity about where the problem actually is.
Photo-Backed Reports
Image upload turns a vague complaint into evidence a municipal officer can act on without a site visit to confirm it.
Status Tracking
Citizens can see where their report stands — submitted, under review, in progress, resolved — instead of wondering if it was seen at all.
Admin Dashboard
Municipal staff get a structured queue of incoming reports instead of scattered calls and messages, sortable by ward, category, and status.
Interactive Map View
Reports plot onto a live map, making it possible to see problem clusters across a municipality at a glance.
What it looks like, in progress.
Concept panels rather than production screenshots — this is still being built.
How the pieces fit together.
A Next.js frontend talks to Supabase for auth, storage, and a PostGIS-backed Postgres database, so location data is queryable at the database layer instead of being computed client-side.
How it actually got built.
- 01
Mapping the complaint flow
Started by writing out the actual steps a citizen takes today to report a problem, and where each one breaks down.
- 02
Designing the data model
Modeled reports, wards, and status history as first-class database entities so the admin side and citizen side could share one source of truth.
- 03
Building the citizen flow
Ward selection, GPS pinning, and photo upload came first — the part citizens interact with had to feel effortless.
- 04
Building the admin queue
Structured the dashboard around what a municipal officer actually needs: what's new, what's overdue, what's nearby.
- 05
Wiring up the map
Layered an interactive map on top of the same report data so patterns across a ward become visible, not just individual tickets.
What's been hard.
Designing for low connectivity
Photo uploads and GPS lookups both need to degrade gracefully on the kind of mobile connections common outside major cities.
Trust without a real municipal partner yet
Building the admin side convincingly before there's a live municipality on the other end means designing from first principles about how that office actually works.
What I'd carry forward.
Structure beats scale early on
Getting the ward → report → status data model right mattered more, early on, than optimizing for a volume of reports the platform isn't handling yet.
The admin side is the real product
The citizen form is simple by design — the actual complexity, and the actual value, lives in how the report is triaged and tracked afterward.
Why this matters.
- Cleaner, better-maintained public infrastructure through faster visibility into problems.
- Faster response times from municipalities working off a structured queue instead of scattered complaints.
- Higher citizen engagement with local government through a channel that actually shows progress.
Where this goes next.
- Pilot with a single municipality to validate the admin workflow against real usage.
- Expand ward coverage once the first pilot proves out the reporting-to-resolution loop.
- Add public transparency views so resolved reports build a visible accountability record.
- Longer term: nationwide deployment across municipalities in Nepal.